Performance monitoring dashboards are no longer just visualization tools; they are critical instruments for operational intelligence, especially in multi-tenant B2B systems where tenant isolation, SLA adherence, and schema agility intersect. Future-ready dashboards must align with the system's architecture to provide reliable, tenant-centric observability that supports both technical due diligence and audit readiness.
Key Architectural Components
- Tenant-Aware Metrics Aggregation: Collect raw telemetry segmented by tenant context, maintaining data isolation while enabling cross-tenant analytics.
- Schema Change Tracking Layer: Implement metadata versioning for frequent upstream schema changes to prevent monitoring blind spots and reduce false alerts.
- Incident Correlation Engine: An automated mechanism that links observed anomalies to tenant-specific SLA contracts and billing entitlements.
- Extensible Visualization Layer: Customize dashboard widgets per tenant or customer role, focusing on key SLA indicators and edge-case exceptions.
Component Integration and Data Pipelines for High-Fidelity Observability
Effective performance monitoring dashboards depend on meticulous design of data pipelines to guarantee data accuracy, timeliness, and multi-tenant fidelity.
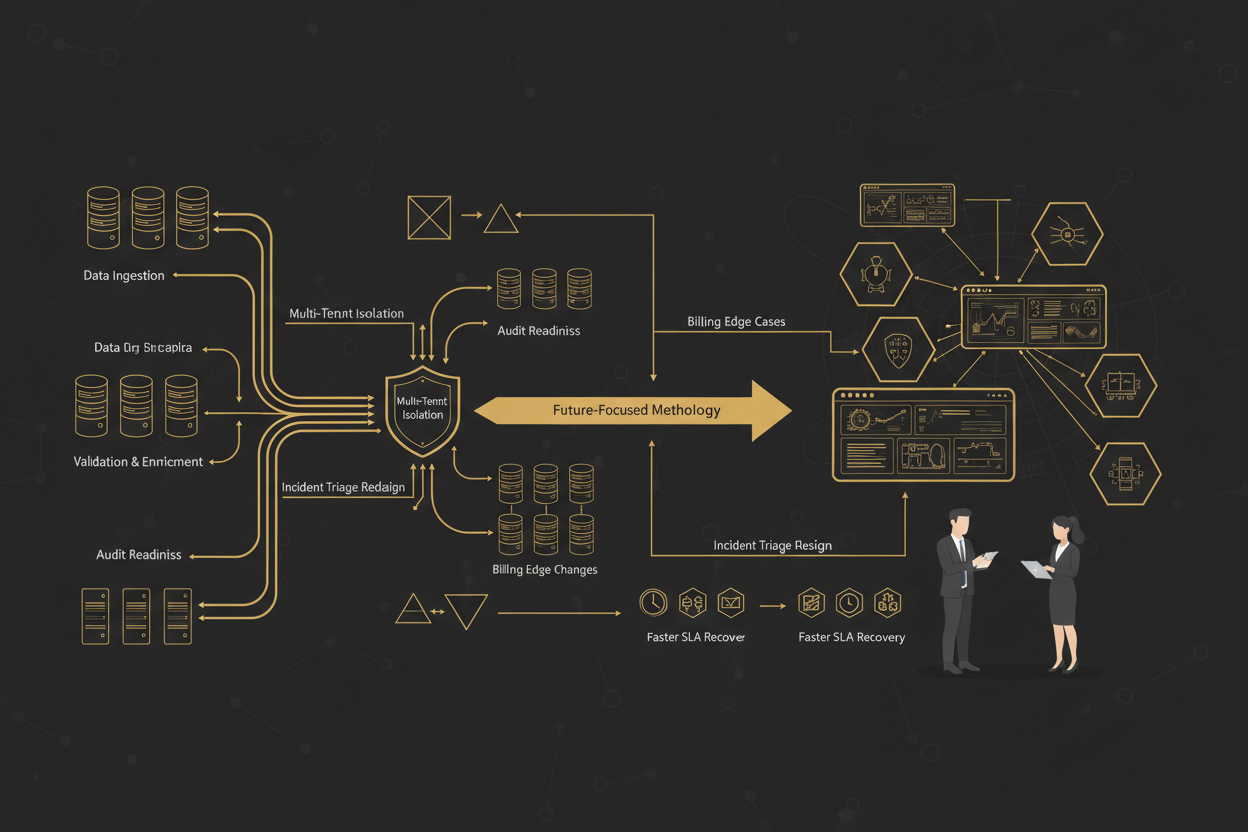
Designing Tenant-Isolated Data Pipelines
- Data Ingestion: Collect telemetry and logs through tenant-aware agents or APIs to tag each data point with tenant IDs at origin.
- Validation and Enrichment: Apply schema validation against tenant-specific models. Enrich data with SLA metadata such as contracted response times or billing conditions.
- Segregated Storage: Store data in logically partitioned or physically isolated stores to uphold data governance and regulatory compliance.
- Stream Processing: Apply real-time filters and anomaly detection that respect tenant boundaries to trigger alerts or adjustments in dashboards immediately.
Implementing Checkpoints for Schema Change Resilience
- Automated schema snapshotting at set intervals.
- Schema compatibility tests integrated into CI/CD pipelines impacting monitoring agents.
- Fallback parsing logic to handle unknown fields gracefully when schemas evolve abruptly.
Failure Modes in Multi-Tenant Performance Monitoring and Their Impact on SLA Recovery
Understanding common failure modes in performance monitoring dashboards enables preemptive mitigation strategies crucial during technical due diligence audit programs.
Frequent Failure Patterns
- Data Contamination: Cross-tenant data leakage leading to inaccurate SLA breach detection or billing errors.
- Schema Drift Blindspots: Missing performance events because upstream schema changes break telemetry ingestion.
- Incident Triaging Delays: Manual or poorly integrated alerting causing sluggish SLA recovery actions.
- Visualization Overload: Dashboards overloaded with irrelevant metrics, delaying root cause identification and tenant communication.
Example Failure Scenario
During an unexpected release of a billing API update, an unnoticed schema change caused the monitoring pipeline to drop tenant-specific latency metrics. Without schema validation checkpoints, the dashboard displayed false SLA compliance, delaying incident triage by over 4 hours and resulting in client dissatisfaction.
Hardening Tactics: Multi-Tenant Isolation Validation and Incident Triage Redesign
Addressing failure modes requires a robust validation checklist and redesigned incident triage workflows embedded in the dashboard architecture.
Multi-Tenant Isolation Validation Checklist
- Ensure telemetry tagging mechanisms at data collection points are immutable and tamper-proof.
- Implement end-to-end data lineage tracing to detect contamination early.
- Regularly audit data segregation in storage with tenant-aware access controls.
- Automate regression testing for schema changes focusing on multi-tenant telemetry parsing.
- Validate alerting rules separately per tenant SLA thresholds to avoid alert fatigue.
Incident Triage Redesign Steps for Faster SLA Recovery
- Alert Prioritization by Business Impact: Automate alert classification by tenant revenue impact and SLA severity to focus on critical issues first.
- Dashboard-driven Triage Workflows: Implement actionable incident widgets linking directly to remediation runbooks and communication templates.
- Tenant-Specific Incident Playbooks: Maintain pre-approved playbooks tailored for common failure scenarios per tenant, enabling rapid manual or automated remediation.
- Post-Incident Analysis Integration: Embed root cause analysis summaries and timeline exports in dashboards for continuous improvement and audit transparency.
Anti-Patterns to Avoid
- Monolithic Dashboards: Avoid centralized dashboards mixing tenant metrics without proper segmentation, leading to noise pollution.
- Static SLA Thresholds: Resist hardcoding thresholds; instead, leverage dynamic SLAs derived from contract metadata.
- Manual Schema Validation: Eschew reactive processes; invest in automation tools within your CI/CD to catch schema breaks pre-production.
Expected Outcomes and Business Impact
Implementing a modern, architecture-aligned performance monitoring dashboard with enhanced multi-tenant isolation and redesigned incident triage delivers measurable benefits:
- Reduced SLA Recovery Time: Automated prioritization and tenant-aware workflows cut mean time to acknowledge (MTTA) and mean time to repair (MTTR) by up to 40%.
- Stabilized Billing and Entitlement Processing: Fewer errors related to edge cases caused by tenant data contamination or schema changes improve revenue assurance.
- Improved Technical Due Diligence Readiness: Precise audit trails and validated isolation meet compliance and acquisition standards with minimal remediation effort.
- Enhanced Customer Trust and Retention: Transparent dashboards with tenant-specific SLA visibility reinforce customer confidence in platform reliability and responsiveness.
Integrating Your Performance Dashboard Within Broader Architecture Programs
Performance monitoring dashboards must not exist in isolation. Integrating them with system-wide initiatives improves outcomes further:
- Link insights from Latency Troubleshooting and Optimization in Event-Driven Automation Pipelines where monitoring data highlights bottlenecks affecting tenant SLAs.
- Leverage governance and operational frameworks such as those described in Incident Timeline Template for Postmortem Compliance, improving incident response and SLA transparency across tenants.
- Coordinate dashboard upgrades with migration blueprints, like Microservice Orchestration with SLA Observability and Alerting, to ensure observability continuity during architectural evolution.
Call to Action: Professional Services for Advanced Monitoring and Audit-Ready Architectures
Building future-proof, multi-tenant performance monitoring dashboards requires expertise across observability engineering, data pipeline architecture, and compliance frameworks. Our professional services specialize in designing and implementing vendor-neutral, scalable monitoring ecosystems tailored for faster SLA recovery, technical due diligence readiness, and business continuity. Contact us to elevate your observability maturity and secure your multi-tenant infrastructure.
Proactive Governance and Continuous Improvement Practices
The lifecycle of multi-tenant performance monitoring dashboards does not end at deployment. Continuous improvement and proactive governance are key to maintaining SLA reliability and operational excellence.
Scheduled Validation and Health Checks
- Daily Data Integrity Audits: Automate verification of tenant data completeness and isolation, comparing ingestion volumes against expected baselines to detect anomalies early.
- Schema Evolution Impact Assessments: Schedule regular assessments post-schema changes with impact reports delivered to engineering and product stakeholders.
- Dashboard Performance Monitoring: Measure dashboard load times and responsiveness, ensuring tenant-specific queries perform within acceptable thresholds to prevent triage delays.
Continuous Feedback Loops with Tenant Teams
- Quarterly Review Sessions: Engage tenant representatives in reviewing dashboard metrics and alerting efficacy, collecting feedback on SLA observability quality.
- Incident Postmortem Sharing: Transparently share incident timelines and recovery information with tenants, reinforcing trust and collaborative improvement.
- Feature Enhancement Roadmap Inputs: Incorporate tenant feedback into planned dashboard upgrades and new alerting capabilities to better align monitoring with tenant business priorities.
Governance Checklist for Ongoing Compliance
- Verify periodic access control audits to ensure tenant users only see permitted data.
- Enforce cryptographic verification of telemetry agents and collectors to detect unauthorized changes.
- Maintain audit logs of schema changes and deployment windows with linkage to CI/CD pipelines for traceability.
- Review and update alert thresholds and playbooks annually or with major platform changes.
- Establish clear escalation paths and communication plans for multi-tenant incidents involving compliance implications.
Implementation Example: Tenant-Aware Anomaly Detection Pipeline
To illustrate the practical adoption of discussed architectural elements, consider the following example implementation of a tenant-aware anomaly detection pipeline integrated into a performance monitoring dashboard.
Step 1: Data Collection and Tagging
- Instrumentation agents emit metrics tagged with immutable tenant identifiers and metadata including SLA class.
- Telemetry is encrypted and sent to tenant-segregated ingestion streams for processing.
Step 2: Stream Processing with Tenant Context
- Ingestion pipeline applies real-time filters validating schema compliance using automated checkpoint snapshots.
- Anomaly detection algorithms run independently per tenant dataset, flagging deviations exceeding dynamic SLA-based thresholds.
Step 3: Alert Generation and Prioritization
- Alerts incorporate tenant context, revenue impact, and SLA severity to rank incidents automatically.
- Notification routing respects tenant organizational hierarchies and communication preferences defined in configuration.
Step 4: Dashboard Presentation and Triage Enablement
- Dashboards render tenant-specific views with direct drill-downs to incident widgets, logs, and remediation guides.
- Incident playbooks are dynamically bound based on alert type and tenant SLA, offering prescriptive next steps.
Step 5: Post-Incident Analysis and Reporting
- Root cause analysis data is collected and linked to each incident record for downstream audit and process improvement.
- Summary reports highlighting SLA adherence over time per tenant are generated for stakeholder distribution.
Checklist for Successful Implementation and Adoption
- Have you defined tenant boundaries explicitly in data pipeline design?
- Is schema versioning with automated compatibility tests integrated into your CI/CD workflows?
- Are alert thresholds customizable and based on contractual SLA metadata?
- Do dashboards support tenant-specific access controls and segmented views?
- Are incident playbooks pre-approved and maintained with tenant input to accelerate triage?
- Are rolling governance checks and audit logs established to ensure ongoing compliance?
- Is there a robust feedback cycle involving tenant teams to evolve monitoring capabilities?
- Are scalability and performance tested to handle peak loads without degrading dashboard responsiveness?
Prioritizing these concrete steps and validation criteria in your implementation process will elevate not only the architecture quality but also drive measurable business value through enhanced SLA reliability and customer satisfaction.
Related reads
Relevant offers
If this article matches your task, here are two offers you can use to move from insight to implementation without extra discovery.
1C exchange and catalog pipeline rollout for 1C-Bitrix
1C exchange becomes a staging pipeline with publish flow, logs, retries, guided configuration and quality control.
Bitrix or website integration with marketplace API
I integrate marketplace APIs with your website or Bitrix so synchronization stops relying on manual workarounds.