Building the traffic analytics module for 1C-Bitrix portcore.analytics
Industry
1C-Bitrix, ecommerce, marketing, security, technical traffic analytics
Period
Case format: building a product module for real 1C-Bitrix site and catalog needs
Role
Design and development of modular visit analytics, GEO and risk signals
Tech stack
Bitrix events and PHP; GeoIP/antifraud API; visit, suspicious-IP and threat-rule tables; admin dashboard with summary and detailed logs
Problem
The initial situation was not about “more charts”, but about the absence of an engineering-grade tool for traffic-quality analysis inside Bitrix. Marketing had numbers, but could not connect them to suspicious IPs, referrer sources, GEO context or section-level behavior.
During design I considered three approaches: keep everything in external systems, add a narrow set of custom logs to one project, or package the capability as a product module. The first option was too weak for technical diagnostics, the second had no reuse value, so the third path was chosen: a standalone module that could be deployed repeatedly and evolved independently of one site.
When I joined "Building the traffic analytics module for 1C-Bitrix portcore.analytics", the pattern was familiar: local fixes existed, but there was no shared model connecting business goals to technical execution. That gap kept incidents recurring and manual overhead growing.
I decomposed the issue into controllable layers: input signals, decision rules, handoff points and post-release quality control. This immediately clarified where performance was being lost and why previous fixes did not hold.
Approach and solution
The chosen solution was a standalone module with dedicated visit, suspicious-IP and threat-rule tables, integration with an external GeoIP/antifraud API and admin screens for traffic review. This immediately removed dependence on scattered custom code.
Several product features were designed and implemented along the way: visit cards with UTM and GEO context, separation between human and bot traffic, suspicious-IP summaries, convenient source filters and a rule set that can be strengthened gradually without breaking the current flow.
Instead of patching symptoms, I implemented a phased model: acceptance criteria first, minimum viable core second, and scale expansion only after stability was proven. This created measurable progress at each stage.
Operational governance was part of the implementation itself: ownership boundaries, deviation handling and explicit escalation logic. That made the outcome repeatable rather than person-dependent.
Architecture
Implementation was iterative: first baseline event capture and storage, then GEO and risk enrichment, then admin summaries and filtering. A separate phase focused on signal accuracy, edge-case debugging and performance checks against live traffic.
The goal was not only to collect data, but to make the module deployable in other projects. That is why the architecture was product-oriented from the start: clear entities, extensible rules and a structure that could continue evolving as a supported product.
Architecturally, the key principle was "observability before complexity". It allowed the team to see real impact of each change and keep control while scaling.
The stack (Bitrix events and PHP; GeoIP/antifraud API; visit, suspicious-IP and threat-rule tables; admin dashboard with summary and detailed logs) was treated as an enabler, not a goal: every decision was evaluated by impact on delivery speed, stability and support cost.
Outcome
The outcome was not an internal workaround, but a real product module that can be shown, deployed and adapted to specific project needs. From an SEO perspective, the case also creates a strong reason to open the product detail and see what makes portcore.analytics more concrete than generic “traffic analytics” claims.
Business impact was not limited to isolated metric gains. The team received a practical operating model with clearer priorities, faster decisions and lower regression risk.
I documented outcomes in a before/after format tied to practical KPIs, so leadership could directly map engineering work to commercial value.
Metrics
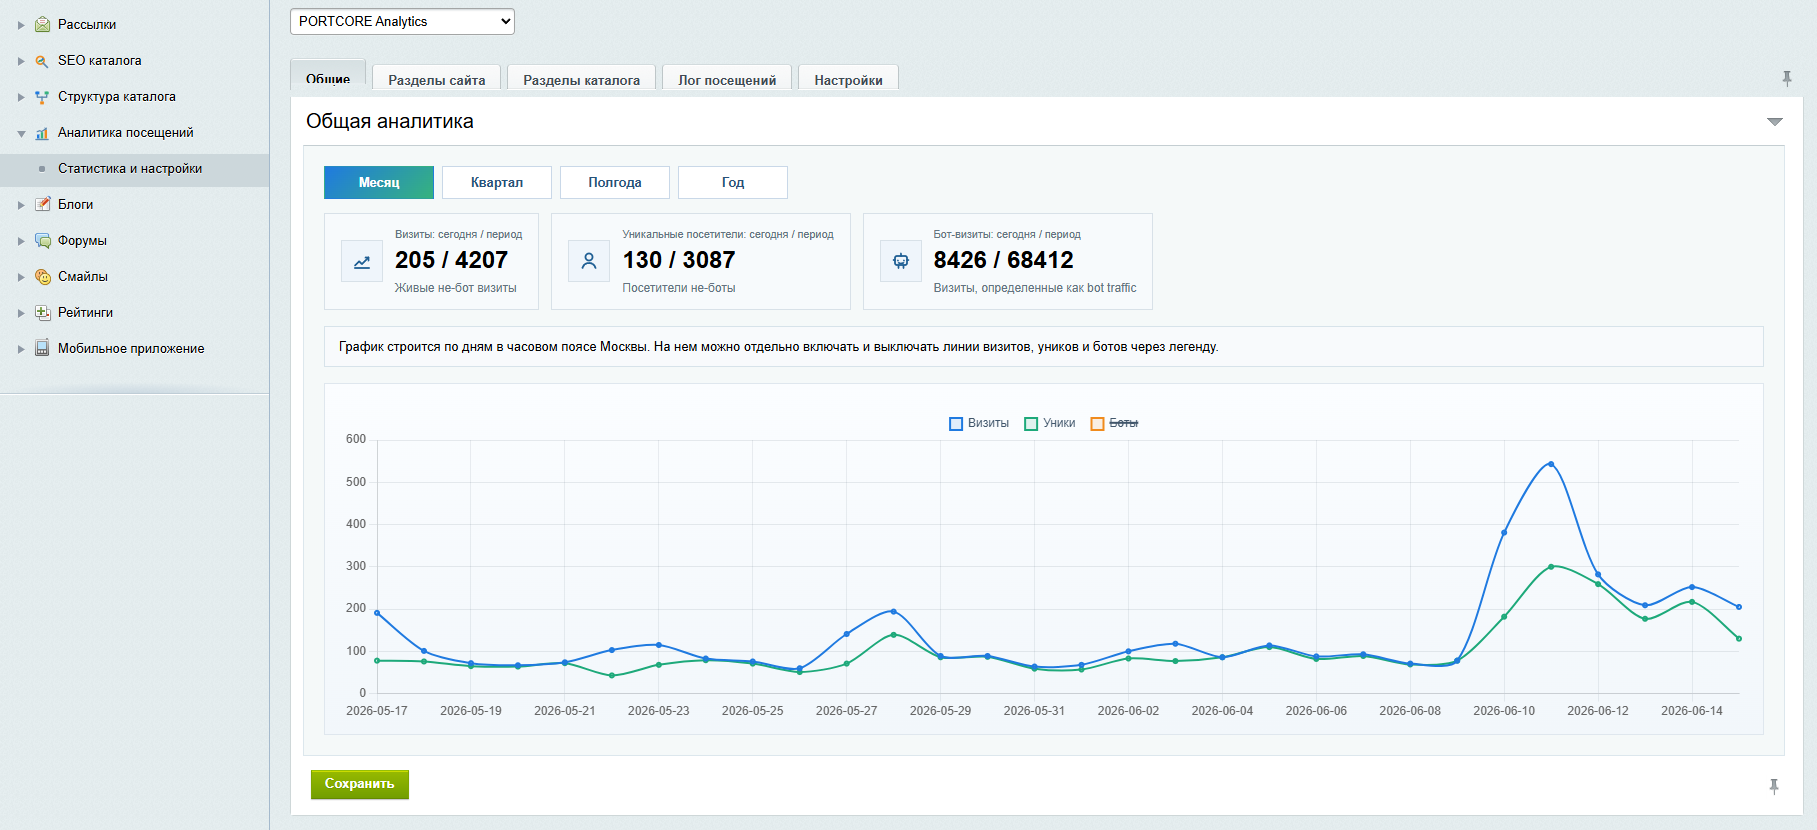
- Summary for visits, uniques, human traffic and bot traffic for today and for the selected period.
- Breakdowns by site sections, catalog sections, referrers, UTM campaigns and search queries.
- Threat rules, suspicious-IP registry and geo threat score for manual and automated filtering.
- Team response speed to deviations and incidents.
- Manual overhead share before vs after rollout.
- Stability of critical user flow under load.
- Release predictability and regression frequency.
- Input quality: less noise, higher useful outcome.
Deliverables
- Visit storage schema plus suspicious-IP and threat-rule dictionaries.
- Admin screen with summary cards, charts and detailed visit inspection.
- Integration with external GeoIP/antifraud source and suspicious-traffic detection rules.
- Warranty support on the license and a predictable path for further report and rule expansion.
- Target architecture map with implementation priorities.
- Phased rollout plan with acceptance criteria.
- Operational runbook and escalation model.
- Post-release quality checklists.
- 30/60-day optimization backlog.
Unique solution in this case
In this case, the differentiator was component-driven Bitrix domain model, risk-aware traffic filtering with explainable decision rules, bot orchestration for inbound scenarios with SLA routing, AI workflow with safe rollout and quality validation. The delivery was not a one-off patch: architecture constraints were fixed first, then a production workflow was rolled out so the team can scale without losing control.
Comparison: before vs after systems rollout
| Aspect | Before | After |
|---|---|---|
| Delivery model | Local fixes without unified architecture | Systems-first rollout with clear architecture logic |
| Operational control | Manual and context-dependent execution | Transparent rules, checklists and quality control |
| Business impact | The goal was to build a Bitrix module that provides technically useful analytics for visits, referrer, UTM, GEO, bot/risk signals and suspicious IPs rather than abstract top-level charts. | The result was a standalone product module with capture logic, enrichment, suspicious-traffic rules and practical admin analytics that can be deployed as a ready-made solution and extended for project-specific workflows. |
How-to: how to replicate this result in your project
- Define business objective and success metric before implementation.
- Map current flow and identify losses in data, time and quality.
- Scope minimum viable rollout with explicit acceptance criteria.
- Launch phased rollout with observability and trace logging.
- Lock support, escalation and iteration workflow.
Practical implementation checklist
- Baseline metrics captured before rollout.
- Integration points and data contracts verified.
- Failure modes and fallback scenarios tested.
- Post-launch quality controls enabled.
- Operational runbook prepared for the team.
- 30/60-day optimization plan documented.
Related services, offers and products
Need a similar case delivered?
Describe your task and I will suggest architecture, scope and delivery format.